Battery Manager Operations Display
In this project, I reimagined how we share information in real time with users in the field. The Battery Manager Operations Display, known as BMOD, provides insight to how a team is performing and what work needs to be done in the battery room of a distribution center. This project also laid the groundwork for redesigning the Touch Computer, another Philadelphia Scientific product.

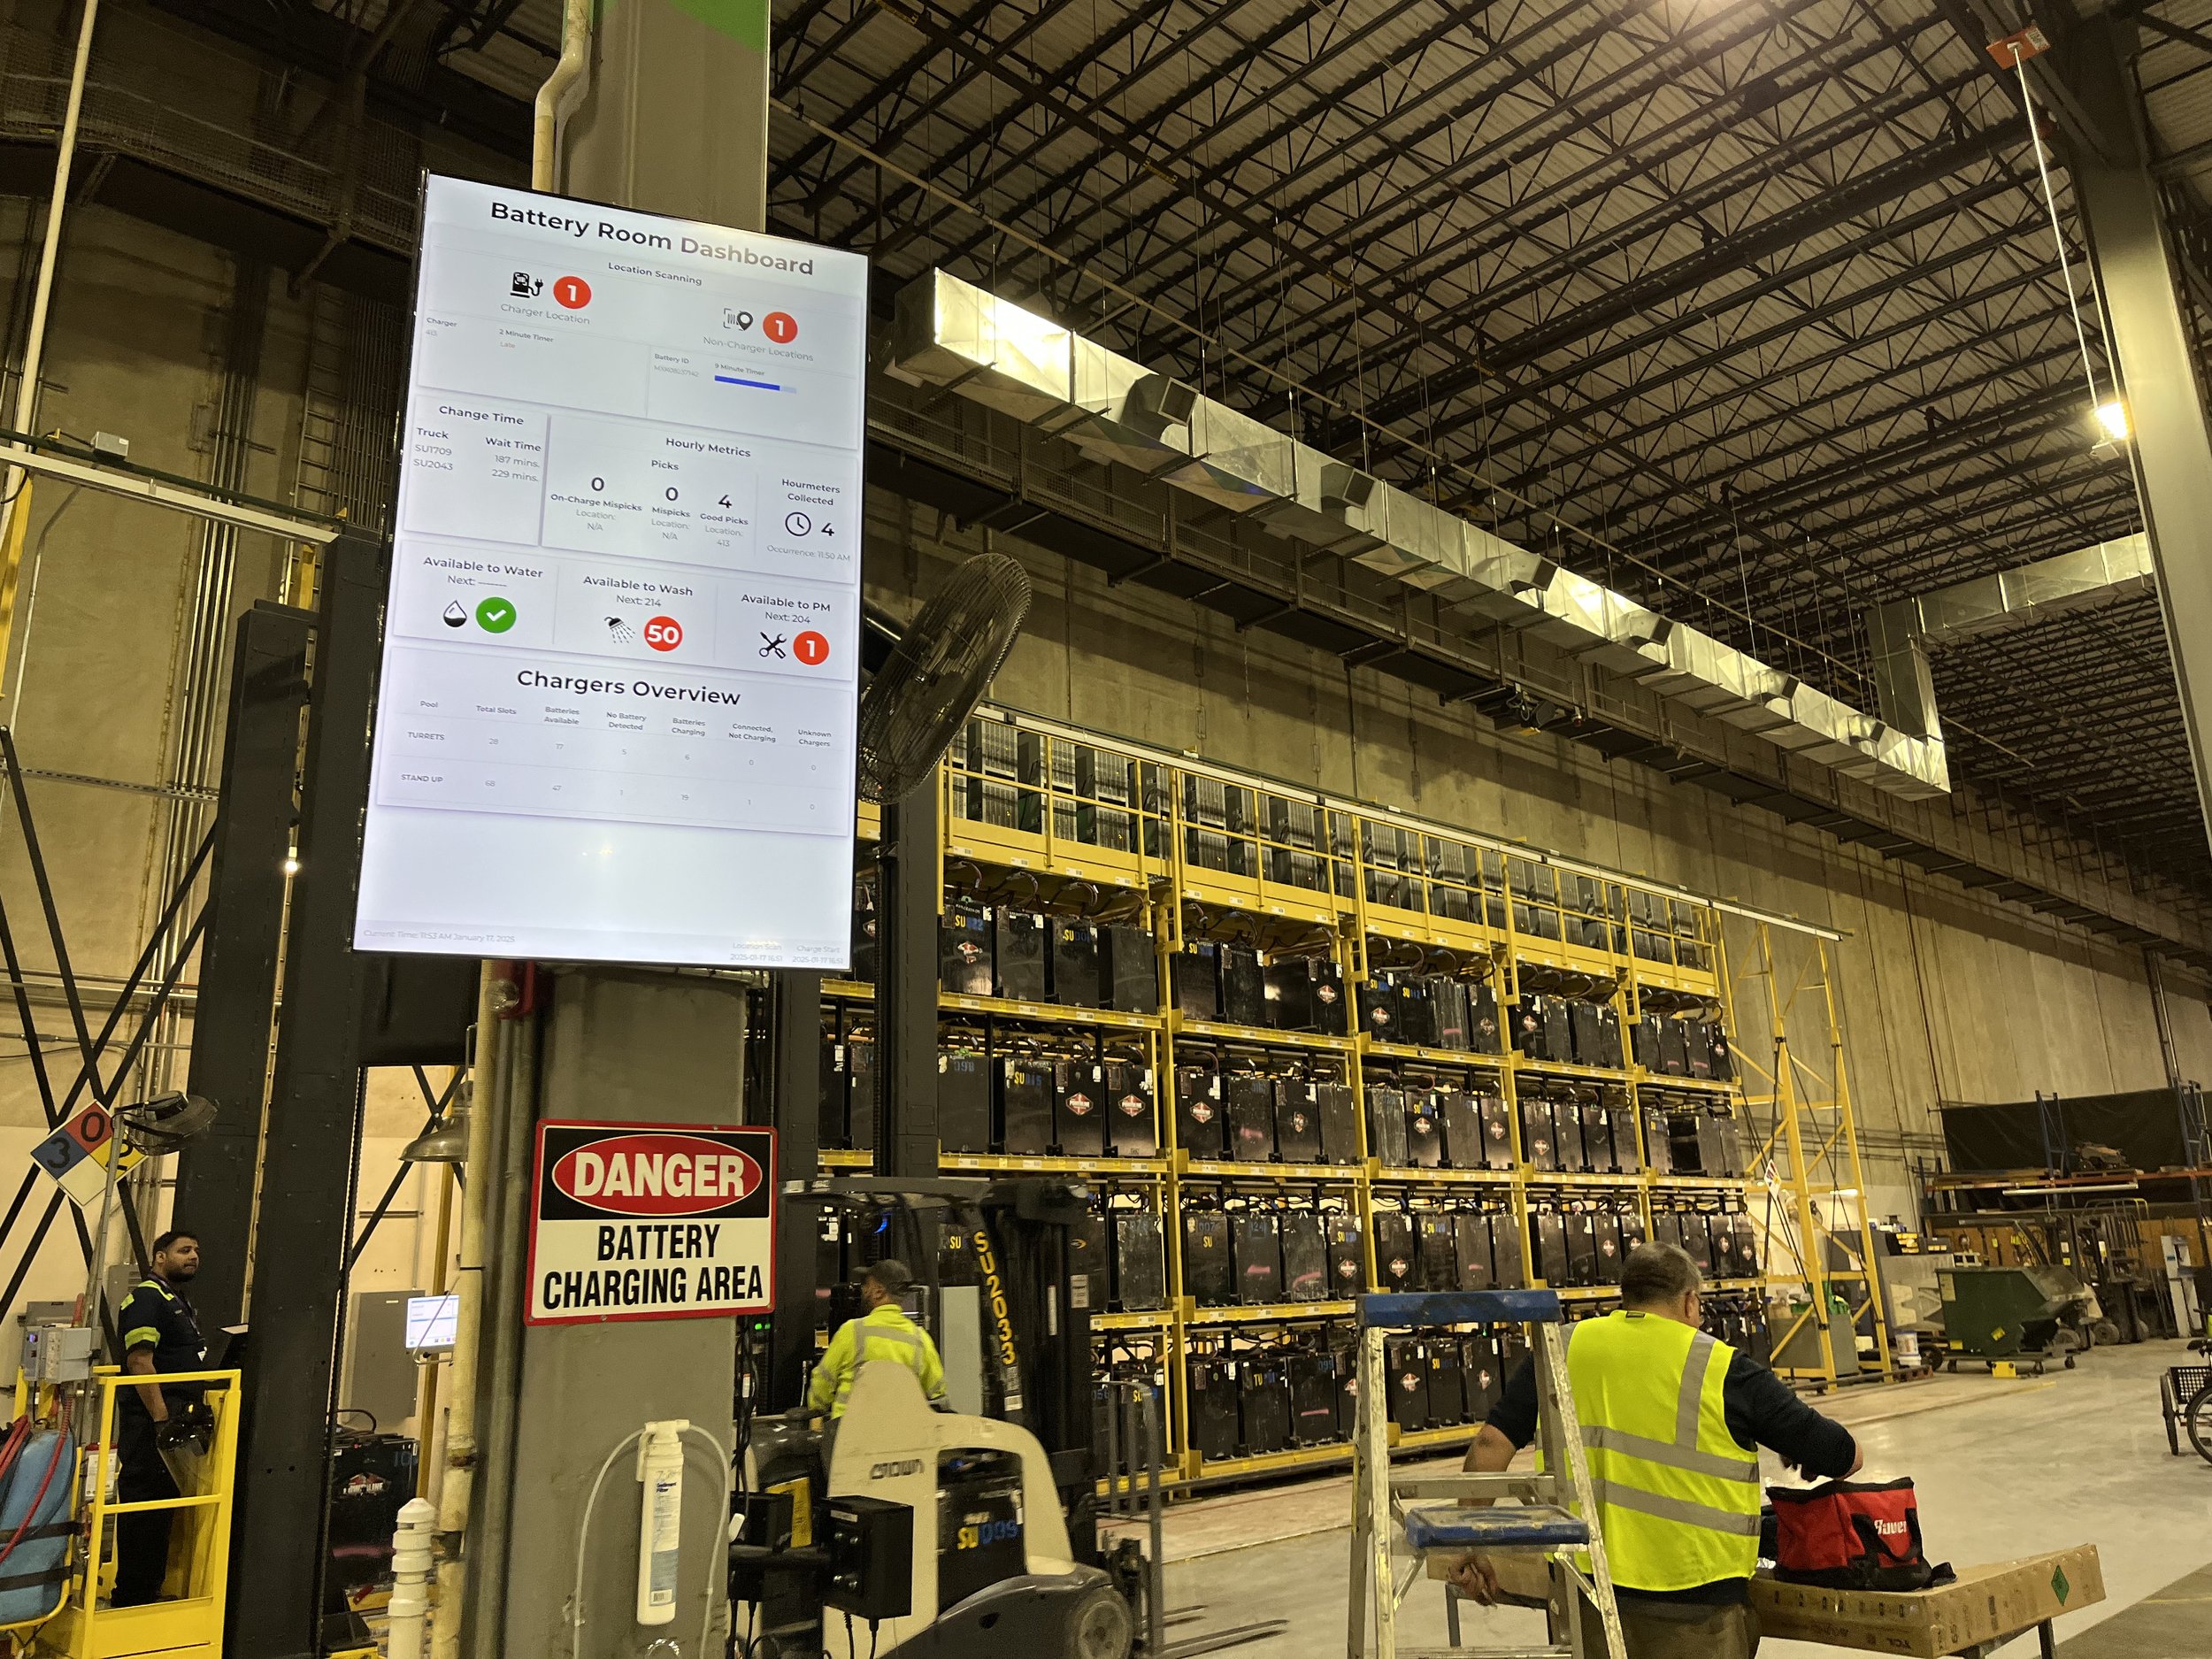
This image shows the Battery Manager Operations Display in use in a battery room at one of our customer sites. The battery room stores dozens to hundreds of lead acid batteries that power the forklift trucks moving goods around. Despite appearances, these batteries are somewhat fragile and require frequent maintenance.
Brief
The project’s scope was to provide clearer prompts and feedback in the battery room of distribution centers. Philadelphia Scientific has the Battery Manager system in distribution centers across the United States and BMOD works with this system to increase efficiency and demystify aspects that were previously unclear.
Lead acid batteries are complex pieces of equipment, and they are what keep distribution centers running. These batteries power various types of forklift trucks that move goods within distribution centers to fulfill online orders or stock retail locations. These batteries can power trucks for upwards of 8 hours depending on the application and battery health. BMOD makes it easier for managers and operators to see what actions they need to record and what maintenance they can do in real time.
Ideation & Exploration
At the outset of this project, we knew we wanted to create a large dashboard-style display that would hang in the battery room displaying an overview of performance and action items the team can work on. Battery rooms are busy places so this display would need to be large enough to read easily from a distance so that managers could read it in passing and immediately see how their team is performing.
I began researching various ways to display data while diving into the nuances of lead acid batteries so I could better understand exactly what happens in the battery room and which metrics are the most vital. I also began considering what types of data visualization are the easiest to understand to a wide audience ranging from those with no experience to some with degrees specifically in supply chain engineering.
Design Process – Version 0
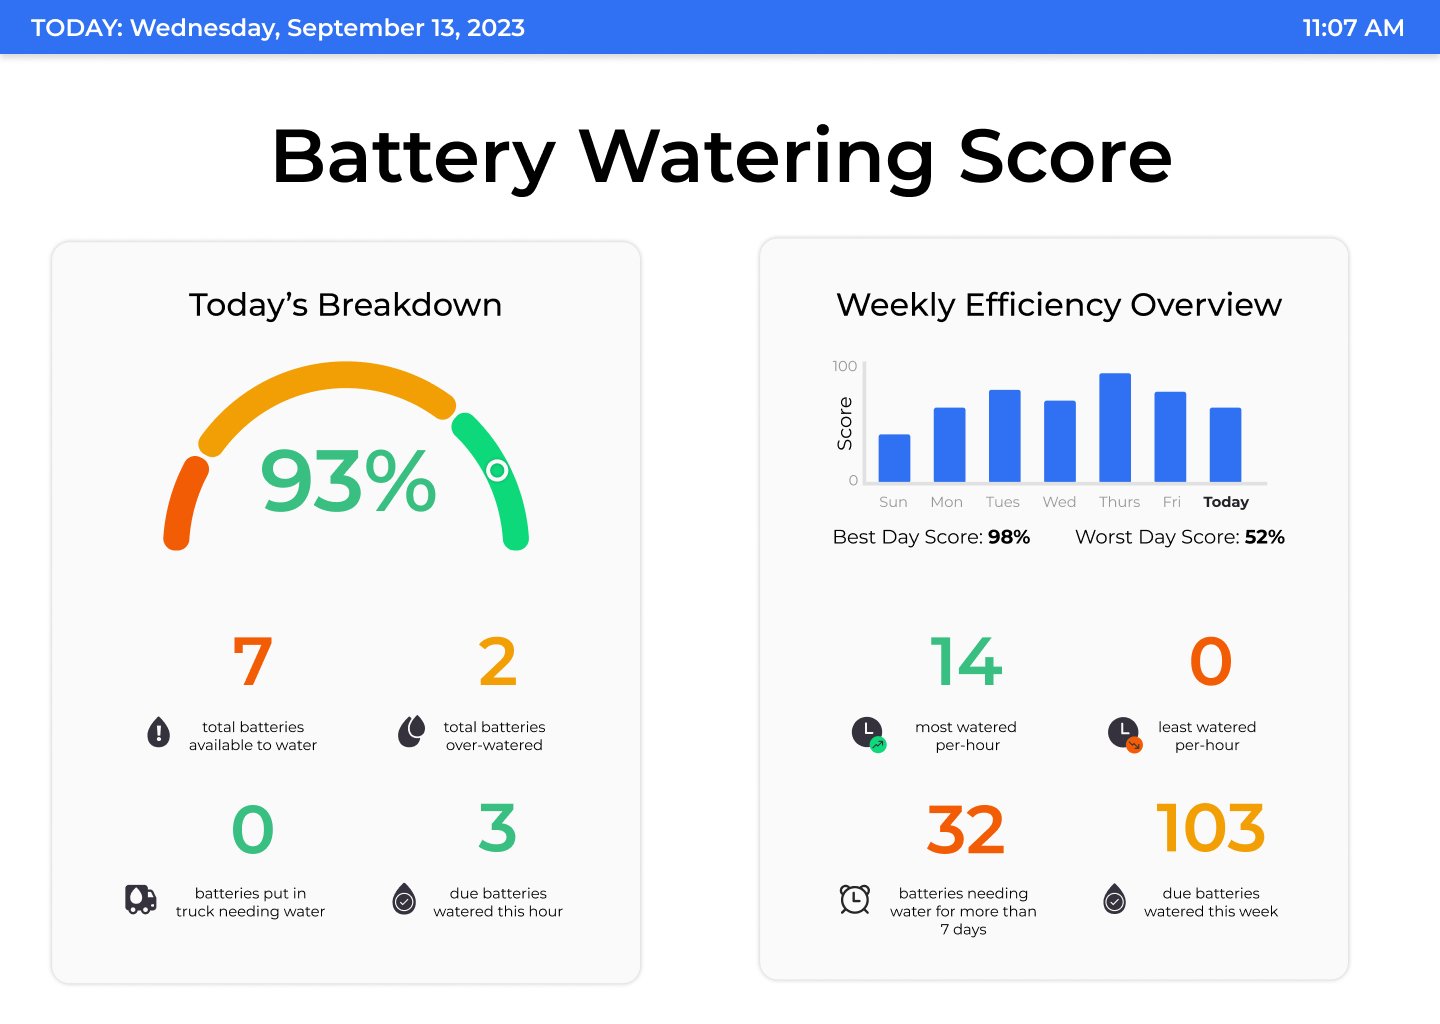
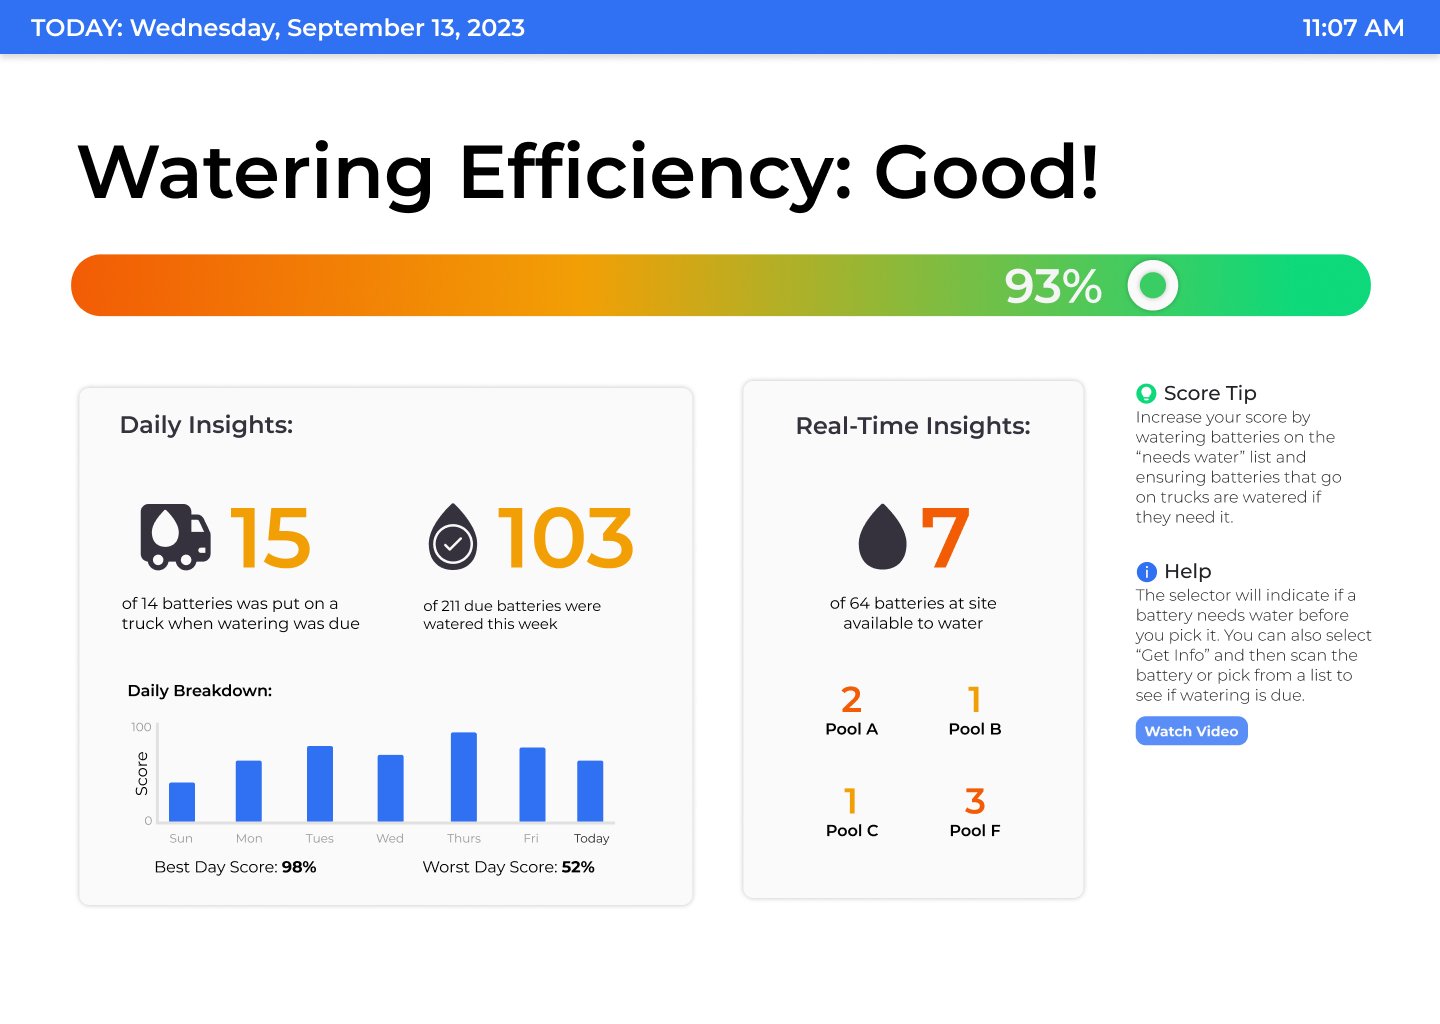
Initially, we spent time exploring ways we could improve the existing Ops Display and ways to balance prompts and feedback. Our first approach to this product focused more on the managerial application and looked at just one maintenance activity. There are three primary maintenance activities that come with lead acid batteries: watering, washing, and preventative maintenance. Watering occurs the most often and is generally accepted to be the most important because it has the most direct effect on a battery’s ability to function. With this in mind, we modeled a new operations display that focused on a site’s watering efficiency.
The final version of this initial concept had four main parts: number of batteries to water, performance this hour, non-watered incidents, and 24-hour performance history.
To test this initial design, we set up a demo system in the office, connected it to a distribution center whose workflow we were already familiar with, and got feedback from our in-office team. This feedback helped us realize that while metrics like non-watered incidents might be of interest to managers, it will be confusing and distracting to don’t want to need a high level view of site activity.
While all of these metrics were valuable, only the number of batteries to water made it to the final design. Once we began integrating the other maintenance topics and necessary metrics, we realized that the rest were either too unclear or too specific for the dashboard style. While the number of batteries available to water was already available on the Touch Computer, this research helped us identify the “Window of Opportunity” which improved how we teach our system and battery maintenance flows.
While performance this hour, non-watered incidents, and 24-hour performance history did not make it to the final dashboard design, they all came together to form the Missed Watering KPI. This metric later became a focal point of the monthly analyst reports where, for the first time, we looked at operator compliance with watering requirements.

This test system lived at the top of our stairs for many months to help us get a feel for usability. It is showing real-time data from one of our client’s sites.
Design Process – Version 1
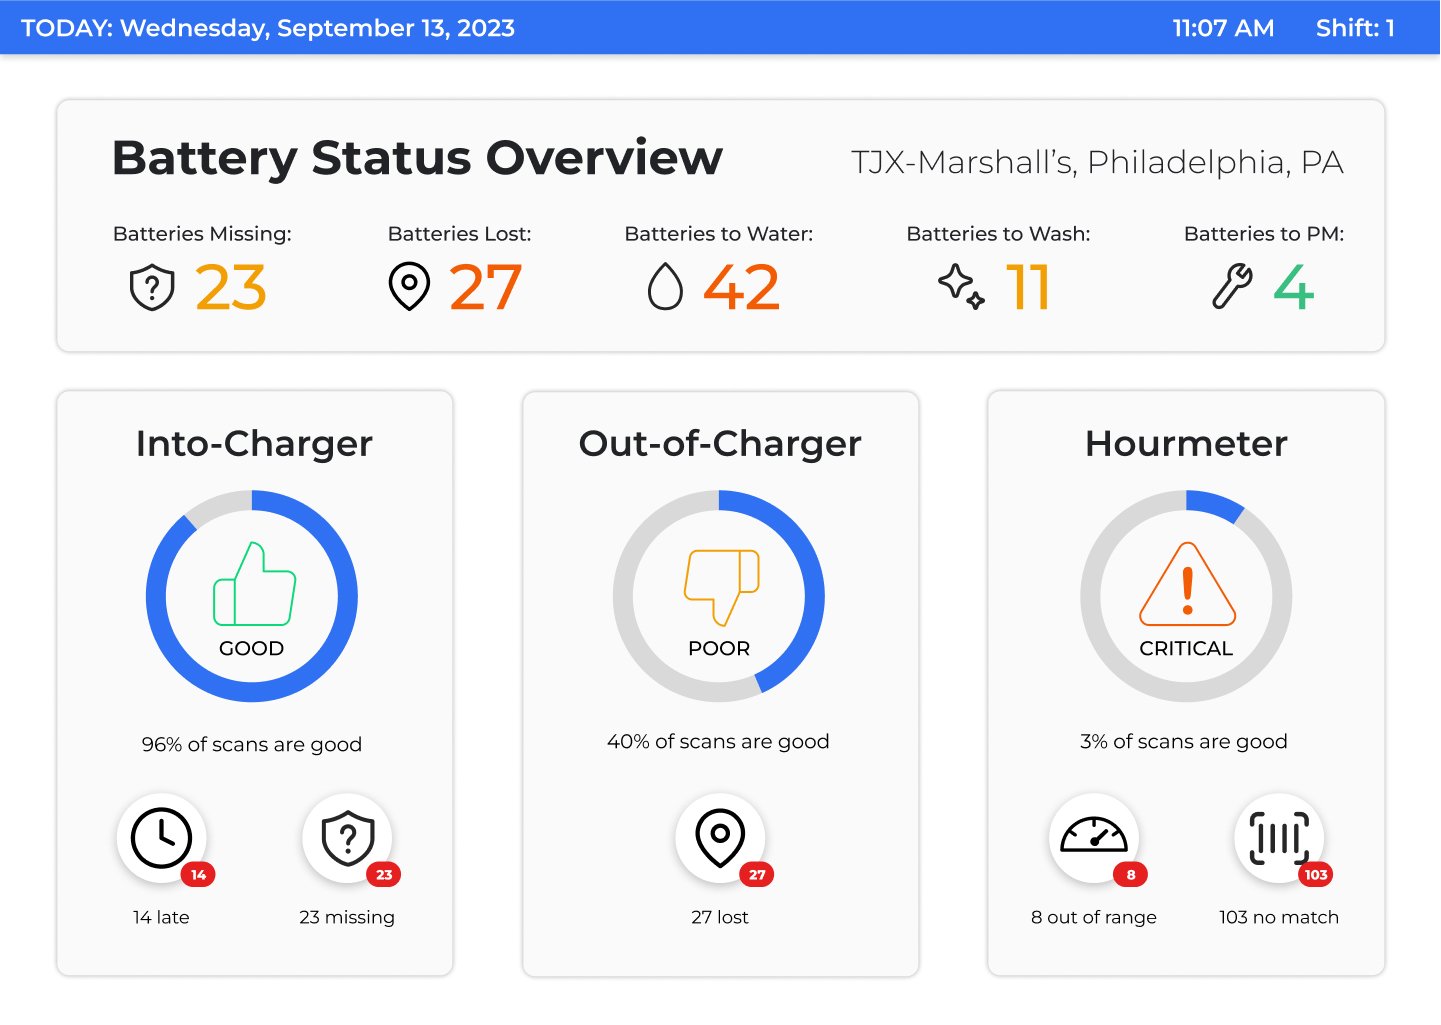
Once investigated what it might look like to go all out on one maintenance activity, we decided to broaden the scope to include all three maintenance activities, location scanning, picks, hourmeter collections, splitters, and the chargers overview.
Every battery change begins with a pick. Operators use Selector to determine which battery they should pick next. Selector guides the operator to pick the most cooled battery. When this action is complete, it counts as one good pick. If an operator picks a battery not recommended by Selector, it can result in a mispick or an on-charge mispick. Mispicks occur when a battery is not fully cooled whereas on-charge mispicks occur when the battery was still charging. Ideally, a site will only have good picks but we show all three types on BMOD so managers can investigate and correct behavior as necessary.
Location scanning is what allows us to do most of the reporting that we provide. All batteries, chargers, and forklift trucks are barcoded so operators can scan various events like a battery changing location from a charger to a truck. If a battery is not scanned into a charger within two minutes of being connected, it is considered “late.” If a battery is not scanned into a truck within nine minutes, it becomes lost. Before BMOD, we did not indicate to operators or managers that there was a specific limit on how much time they had to scan a battery so adding the location scan timers greatly demystified this process.
Splitters are another product unique to Philadelphia Scientific. The hardware allows one charger to serve two charging slots. This setup benefits sites because they do not have to spend as much money on chargers or the electrical infrastructure to support them while maintaining enough slots to house the batteries a site needs for the usage demands. Once a battery has finished charging, the connector is switched to the other slot so another battery can charge while the first one cools. Splitters are only as effective as the team using them, so the splitters portion of BMOD shows when splitters are ready to be switched to guide the teams’ efficiency.
The chargers overview is more of a managerial and troubleshooting tool. The number of batteries available and batteries charging can indicate whether a site has enough batteries to support them, while chargers in quarantine identifies whether there are chargers that need maintenance.
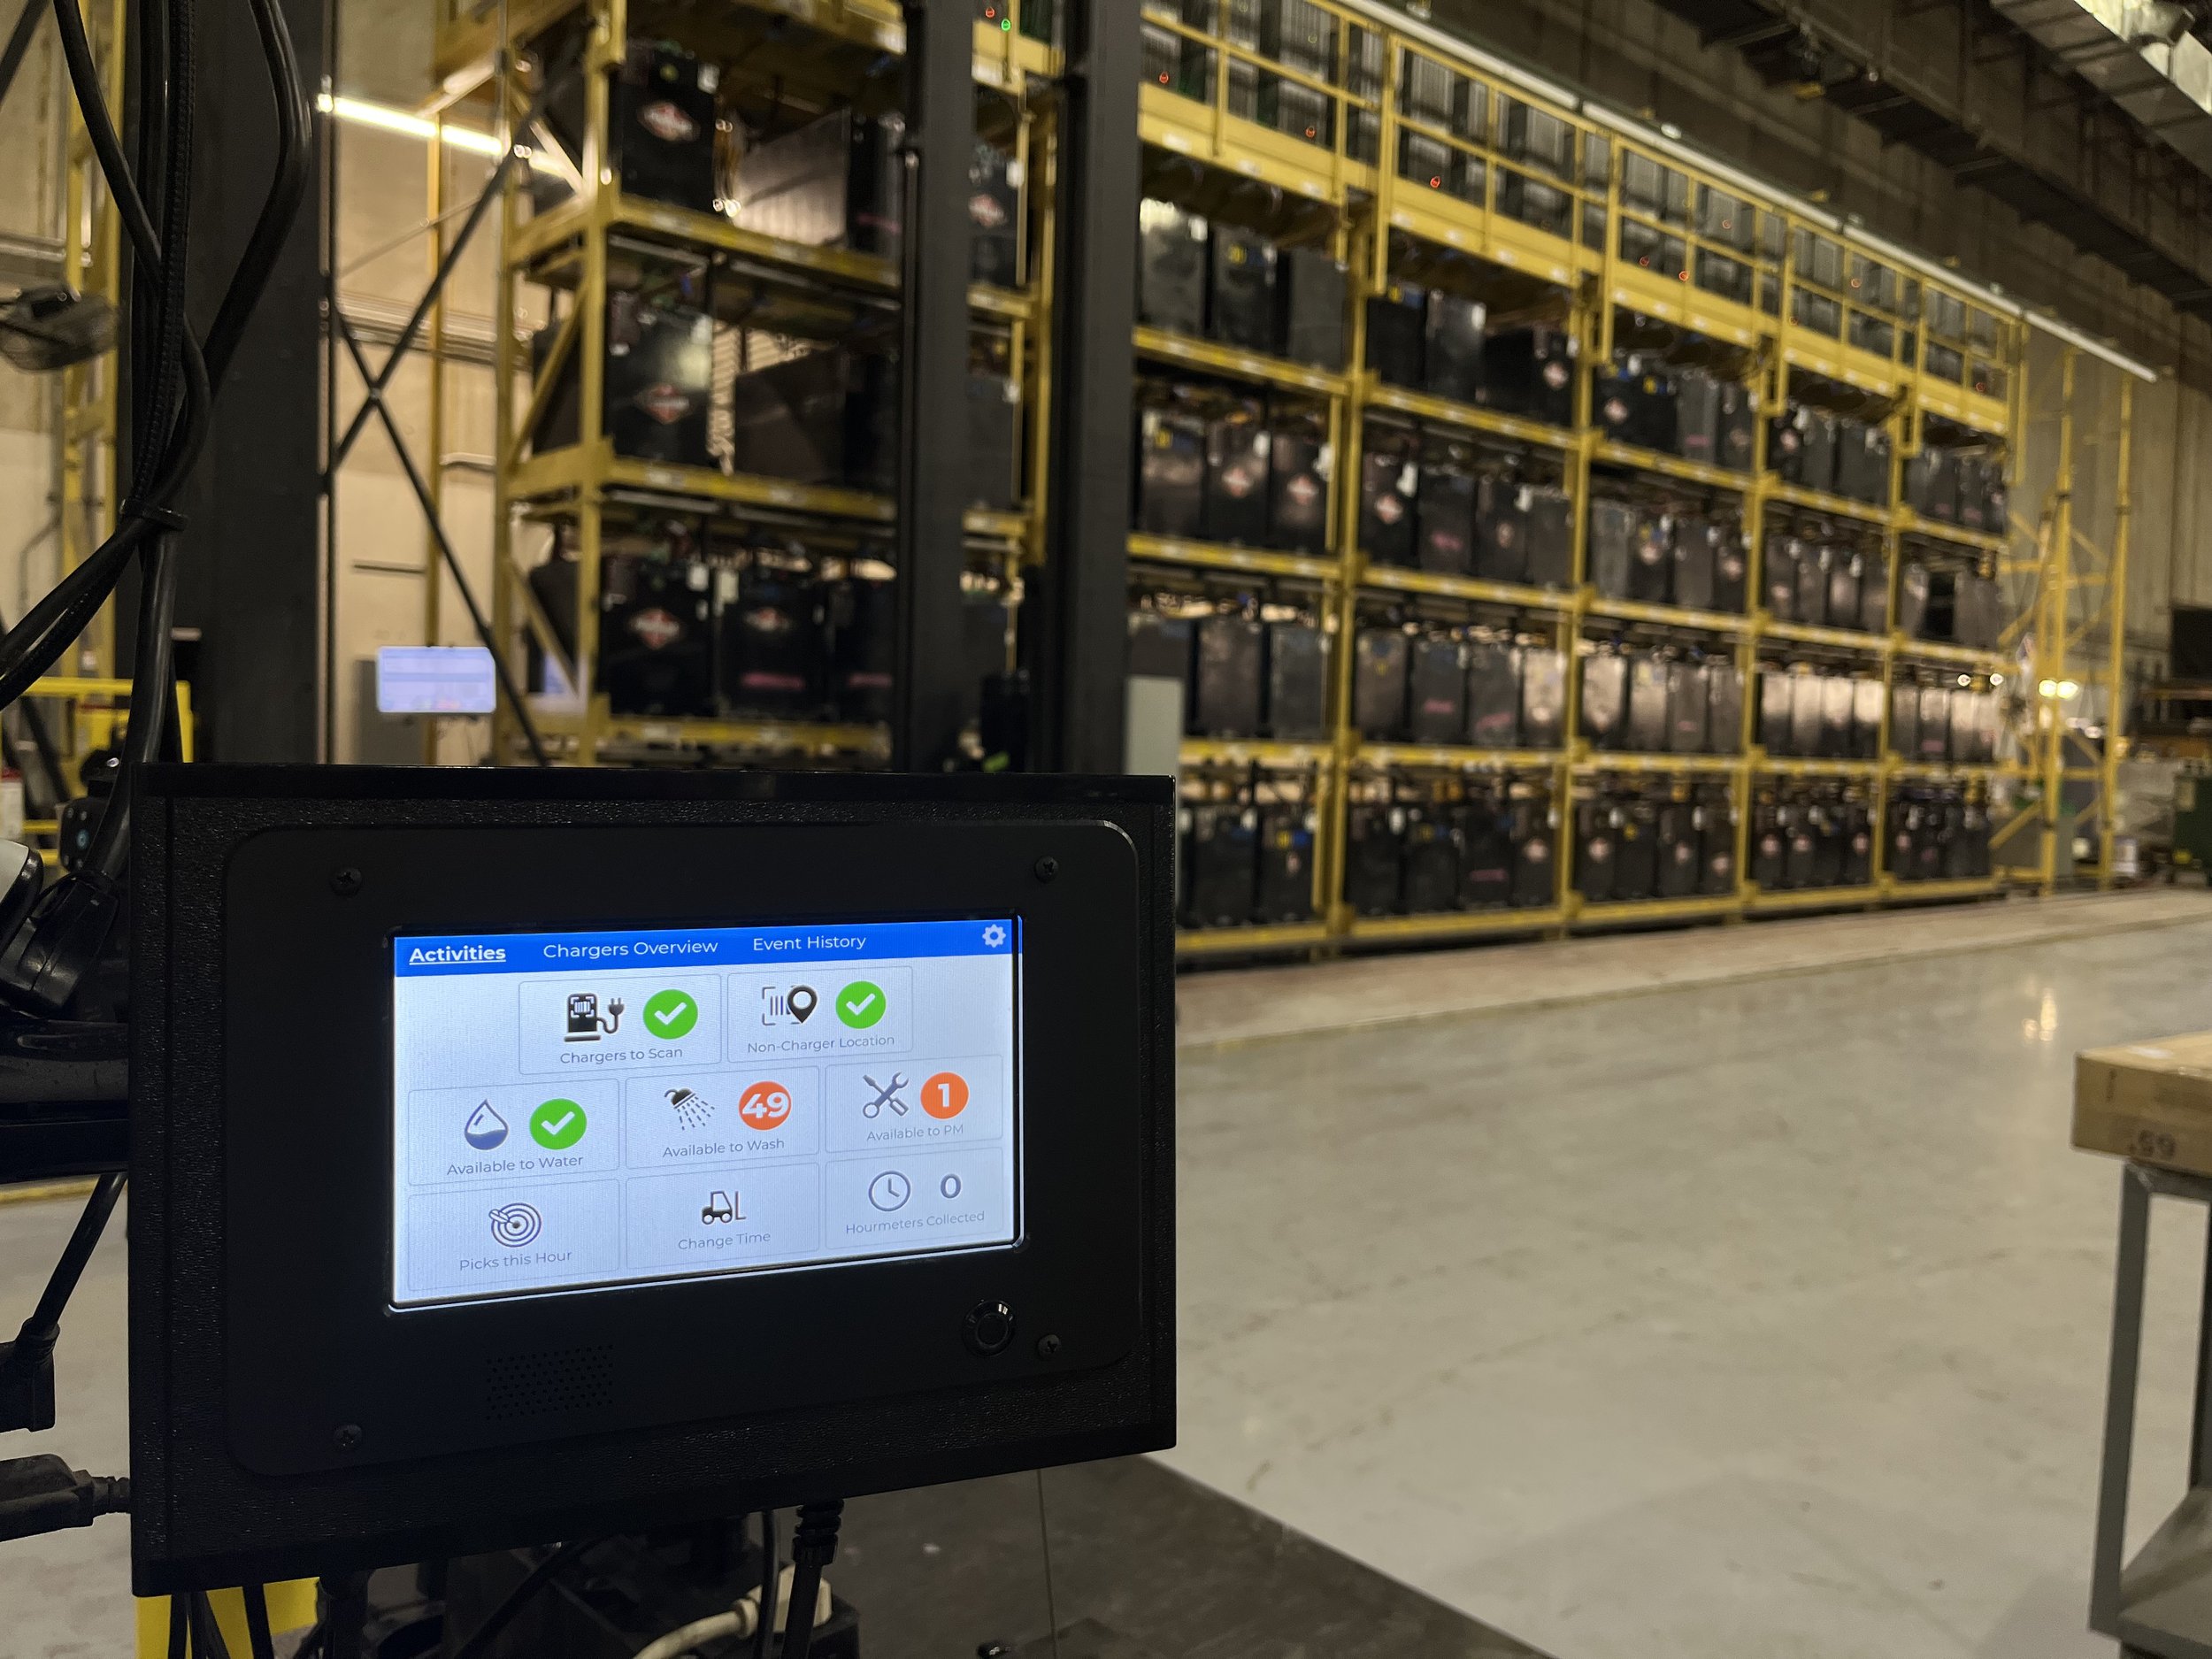
Once we had the design nailed down, we began working on a smaller screen to accompany it. This device allows users to drilldown into each item shown on the big screen so they can see the details associated with it. Primarily, these drilldowns contain lists of the items represented by numbers on the big screen.
One unique feature to the small screen is the “Event History” page. This feature shows all events occurring in the battery room in real time. This information allows managers to stay out of the way while observing how operators use the system. Having this information also helps us find unexpected sequences of events and better understand user behavior.
Results
The results of this project are a product that helps operators use the Battery Manager system more effectively and allows managers real-time information at a glance.
Testimonials
“It’s good for having conversations with team members for less damage and better results.”
— Distribution Center Operations Manager of Engineering
“It’s pretty neat; it’s one of the first things I see, and I can skip the step of looking at the [Touch Computer].”
— Distribution Center Battery Room Operator